What this guide is about
Most WooCommerce performance guides give you 14 tips and a plugin pitch. This isn’t that.
This is the framework we use to take WooCommerce stores from 8-second load times to half-second page loads (460-560ms) – without replatforming, without breaking what works, and without pretending plugins are the answer.
The TL;DR:
- The average WooCommerce store loads in 8.6 seconds. Half-second page loads (460-560ms) are achievable on the same platform.
- Six areas cause 80% of revenue leakage: hosting, theme, plugins, images and assets, database, and UX patterns.
- A $100K/month store loses $33K to $66K monthly to performance and UX failures it can resolve.
- Optimization pays back in 3–4 months. Headless builds pay back in 12+.
- Headless suits high-volume stores (roughly $3M+/year). Below that line, most stores reach the same half-second page loads (460-560ms) through optimization, for about a third of the cost.
If you’d rather skip the read and have us run the audit on your store directly, start my audit. You get specific findings – including the dollar impact of each performance issue.
A note before we start: We work with all kinds of WooCommerce store owners. Some are hands-on technical founders who want to understand every detail. Others want their store to work and prefer to leave the complexity to experts. Both are valid.
If this guide starts to feel like a lot, that is the point – this is complex, which is why we have spent 10 years on it. Skip to the bottom for how we help, or keep reading to understand what is happening under the hood.
The rest of this guide is for store owners who want to see the methodology before they hand over admin access.
What is WooCommerce performance optimization?
WooCommerce performance optimization is the process of reducing your store’s page load times, improving Core Web Vitals, and resolving the user experience patterns that cost you sales – without rebuilding the platform underneath.
It’s not the same as conversion rate optimization (CRO). CRO tests variations of copy, layout, and offers. Performance optimization resolves the underlying mechanics: how fast pages load, how cleanly checkout runs, how reliably search returns results.
It’s also not the same as replatforming. Replatforming means moving to Shopify, BigCommerce, or building a headless front-end. Optimization keeps WooCommerce as your back-end and resolves the issues without migrating anything.
Three things make WooCommerce-specific optimization different from generic ecommerce advice:
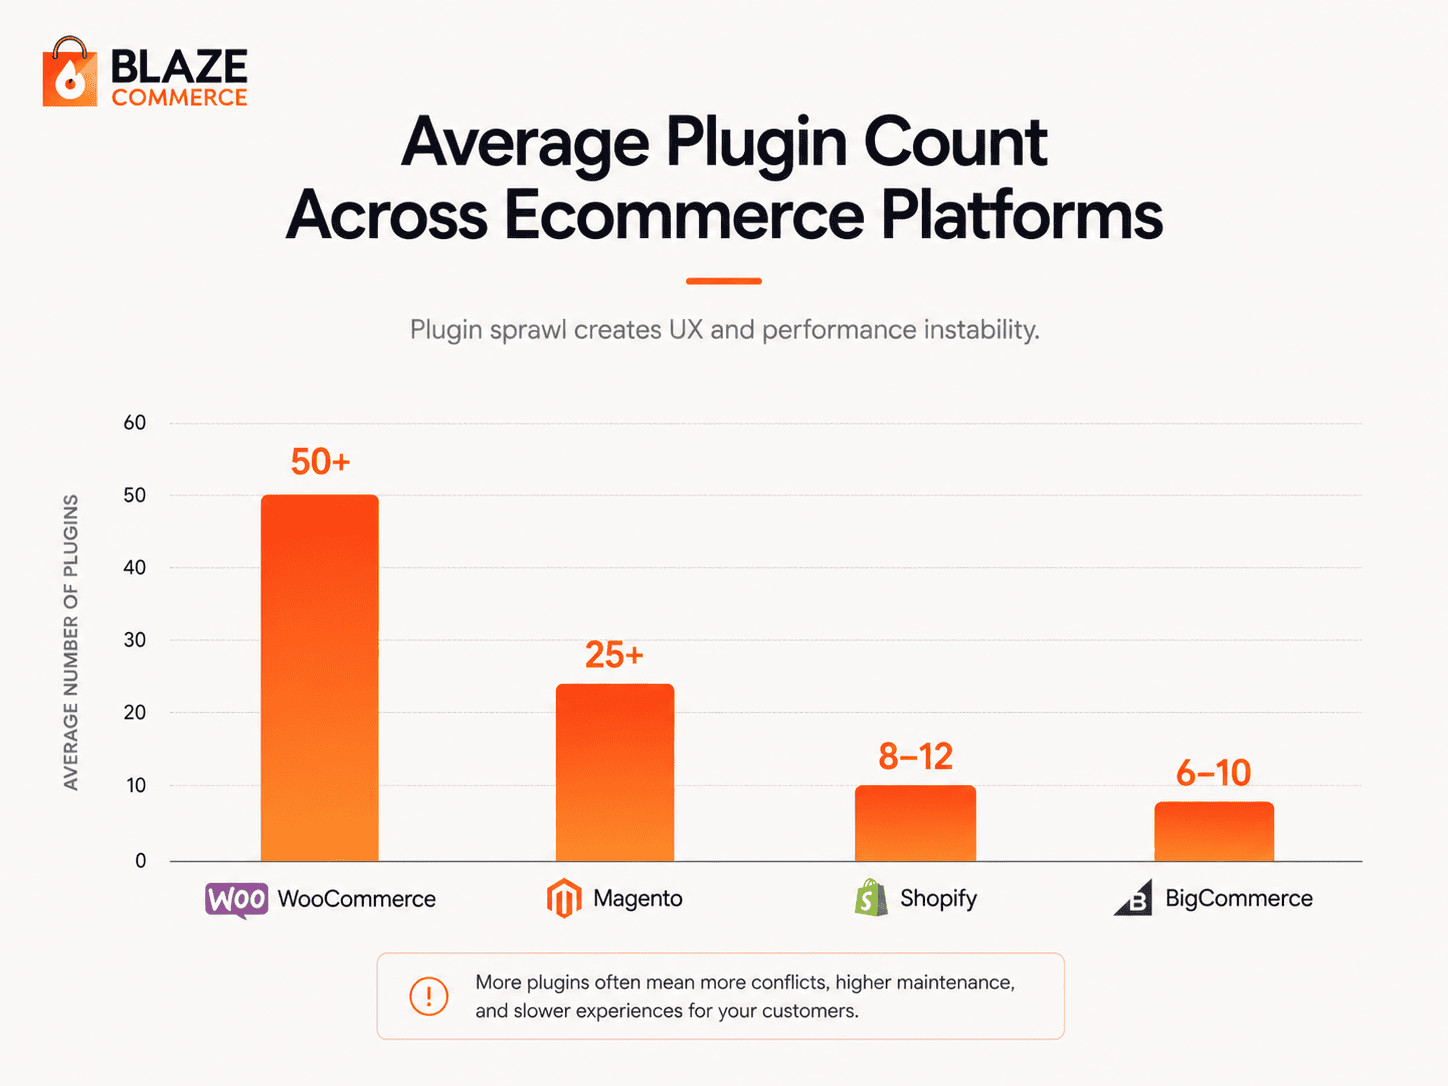
Plugin sprawl. The average WooCommerce store runs 20–60+ active plugins. Each one adds JavaScript, CSS, database queries, and admin overhead. Generic optimization advice ignores this.
Page builder constraints. Elementor, Divi, and Avada lock theme patterns into rigid templates. The performance ceiling on a builder-based theme is roughly half what you can achieve on a Full Site Editing theme.
Hosting and theme mismatches. A pattern that loads in half a second on a Full Site Editing theme on Kinsta stalls at four seconds on Divi on shared hosting. Generic advice ignores these constraints because hosted platforms hide them.
This is why a WooCommerce performance audit has to be layered with platform-specific knowledge to deliver real revenue impact. The research is rigorous. The application requires expertise.
The result: most WooCommerce stores get UX advice they can’t act on. Or they hire a generalist agency that implements the advice and breaks something else in the process.
This is why Baymard’s methodology has to be layered with WooCommerce-specific knowledge to deliver real revenue impact. The research is rigorous. The application requires platform expertise.
What does Baymard’s 130,000-hour research tell us about ecommerce UX failure?
Skip this section if you don’t care about research methodology – the next one is where we name the failures. But this part matters because it’s why our diagnostic means anything in the first place.
Baymard Institute has run over 130,000 hours of usability testing on real ecommerce sites. Four benchmarks: mobile commerce, checkout, product page design, homepage design. Their methodology is the only one in ecommerce UX research that holds up under scrutiny.
Three findings matter most:
- Cart abandonment sits around 70%. That’s not a fluke. That’s the baseline of what every store is losing right now.
- The average large ecommerce site fails 60+ of the high-severity UX patterns Baymard tests for. Most stores don’t know which ones.
- Mobile users abandon at higher rates than desktop – even when load times match. The gap isn’t speed. It’s UX.
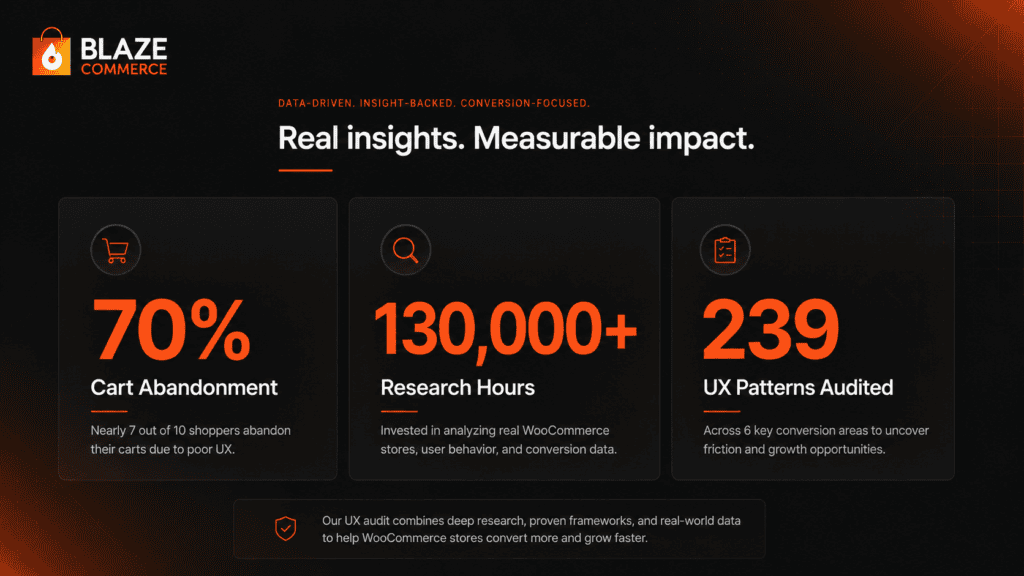
Translation: 70% of people who add to cart leave without buying. That’s not bad luck. That’s specific, identifiable friction your store is creating. Every pattern resolved reduces that 70%. Every reduction compounds against your traffic and AOV.
The six-figure question is which patterns to resolve first. That’s what the audit answers.
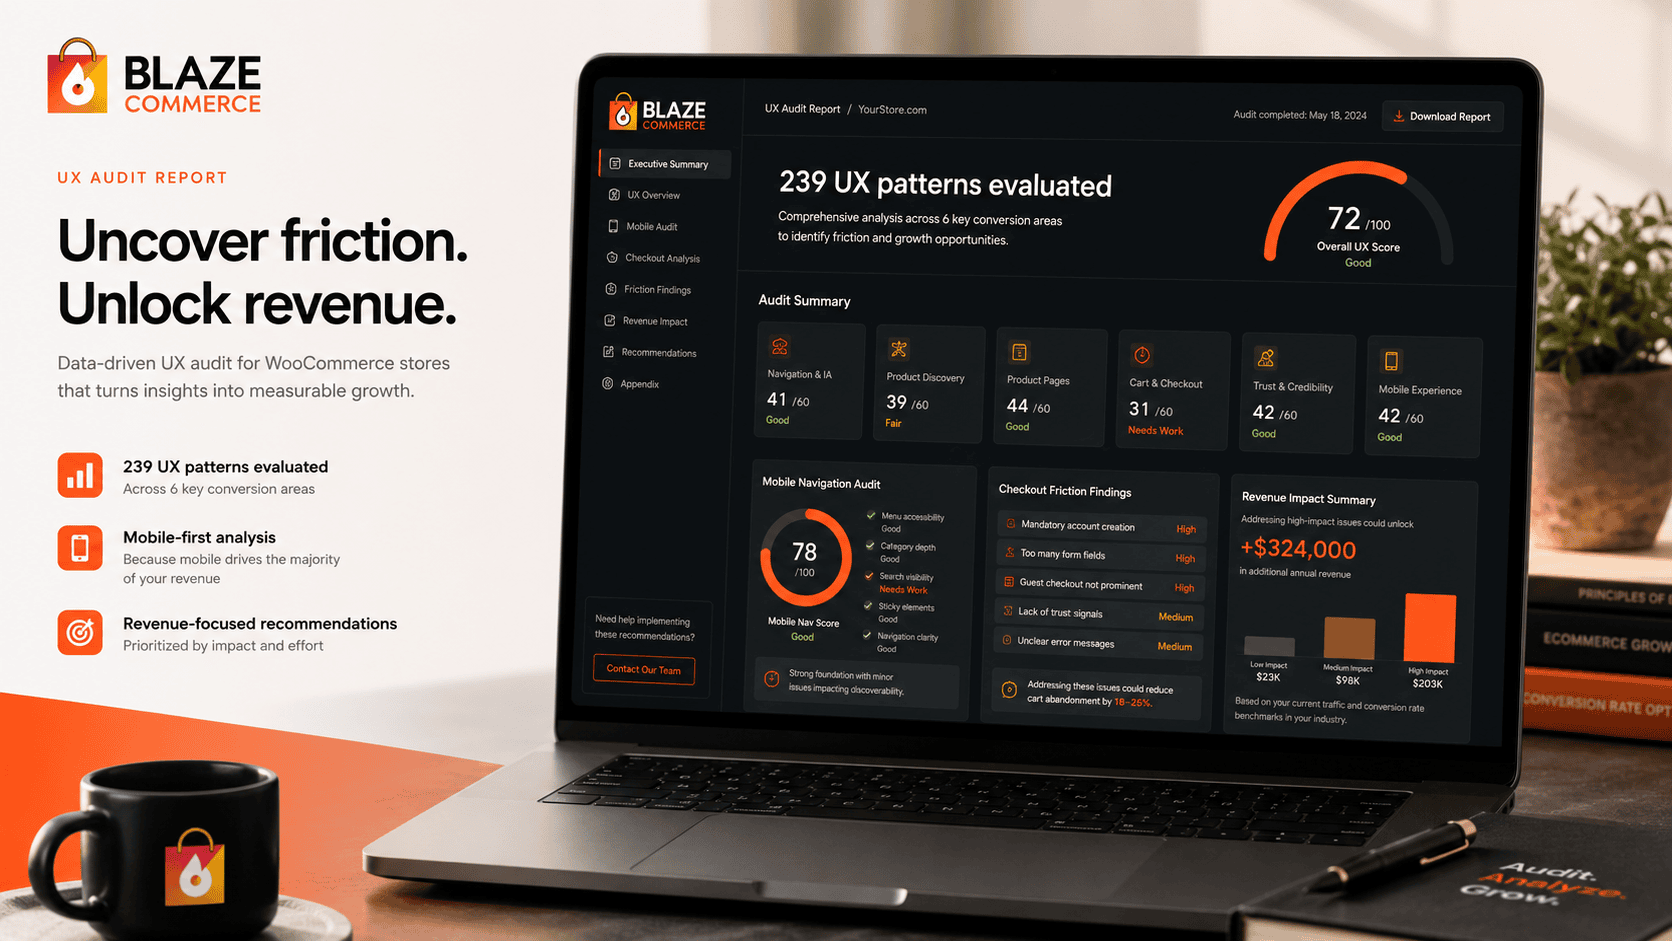
We’ll show you exactly where your store loses revenue.
We audit your store across UX, performance, and conversion, then show you the specific issues costing you orders – each one measured against revenue impact. You get a prioritised list of what’s losing money and what it’s worth to resolve.
- ✓239-point Baymard UX audit
- ✓Core Web Vitals + LCP + CLS benchmark
- ✓SemRush health benchmark
Every finding comes with the revenue it’s costing you and the lift from resolving it. You decide what’s worth doing.
Where do most WooCommerce stores fail the UX audit?
The patterns come from Baymard Institute’s research – the gold standard for ecommerce UX – layered with what we’ve learned working exclusively on WooCommerce stores since 2015. We’ve run this audit on 100+ stores. Six categories account for the highest revenue impact when they fail.
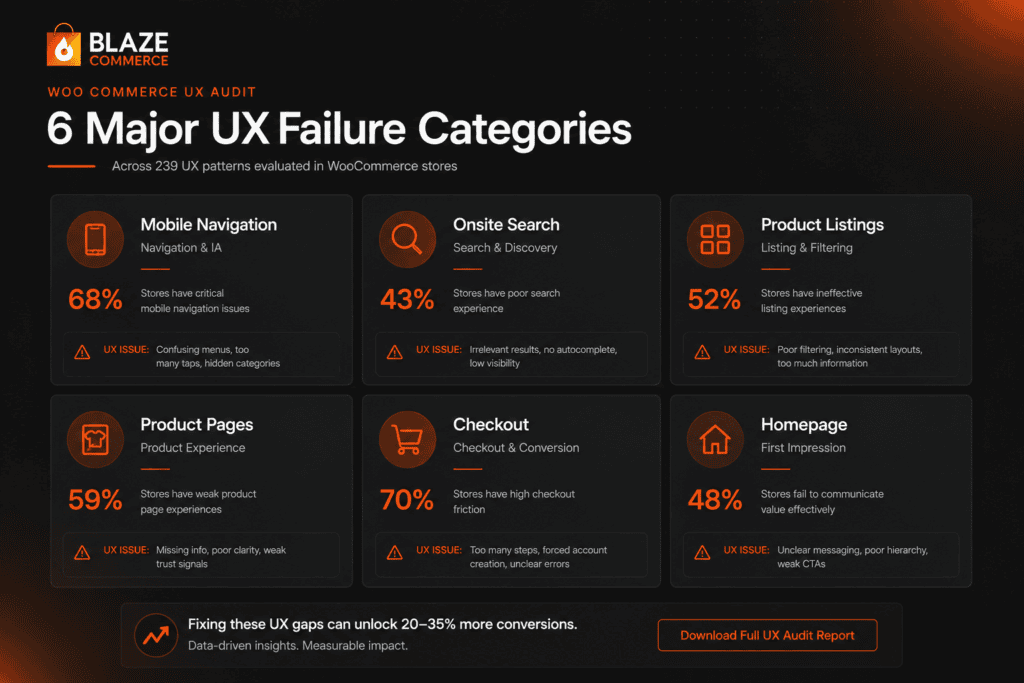
If you don’t want to work through the technical breakdown, the headline is this: mobile navigation, onsite search, product listings, product pages, checkout, and homepage. Each one explained below.
1. Mobile header and navigation
The most common failure category. Patterns that fail repeatedly: search hidden behind an icon instead of exposed in the header, hamburger menus that bury category structure under three taps, sticky elements that block content on scroll, and tap targets sized below 44px.
Mobile traffic is 60–80% of most stores. A header that fights the user on phone is a header that’s killing conversion across the majority of your traffic.
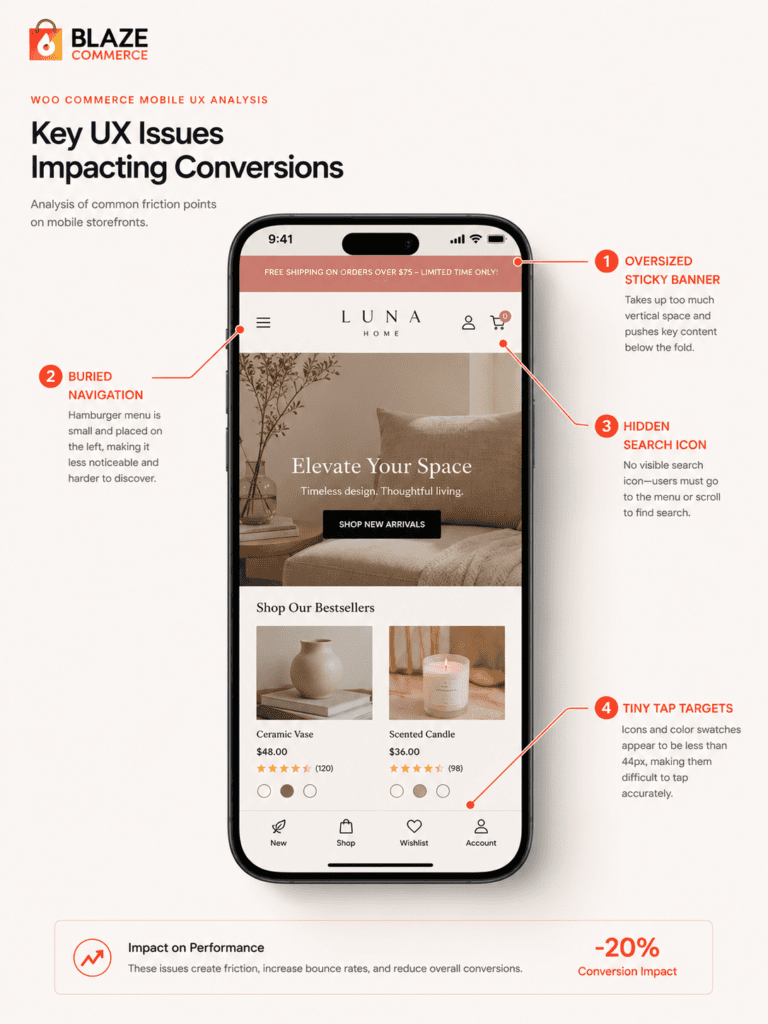
2. Onsite search
Search is the second-highest revenue driver per visitor on most stores. When it works, conversion lifts dramatically. When it fails – and on WooCommerce it fails often – visitors leave.
Common failure patterns: no autocomplete, filter combinations that crash the page, irrelevant results sorted by date instead of relevance, no “no results” recovery, no synonym handling. 50%+ of clients we audit have search/filter issues serious enough that they’ve had to disable features.
3. Product listing and filtering
Once a visitor finds a category, the listing page decides whether they reach a product or bounce. Failure patterns: facet UX that requires two taps to apply, sort defaults that bury bestsellers, infinite scroll without “back to position” memory, mobile pagination that loses the scroll point on return.
4. Product page conversion
The highest-leverage page in the funnel. One pattern resolved here can shift conversion by full percentage points.
Failure patterns: image galleries that don’t zoom on mobile, variant selection that hides out-of-stock options instead of showing them disabled, trust signals buried below the fold, mobile add-to-cart placement that requires two scrolls.
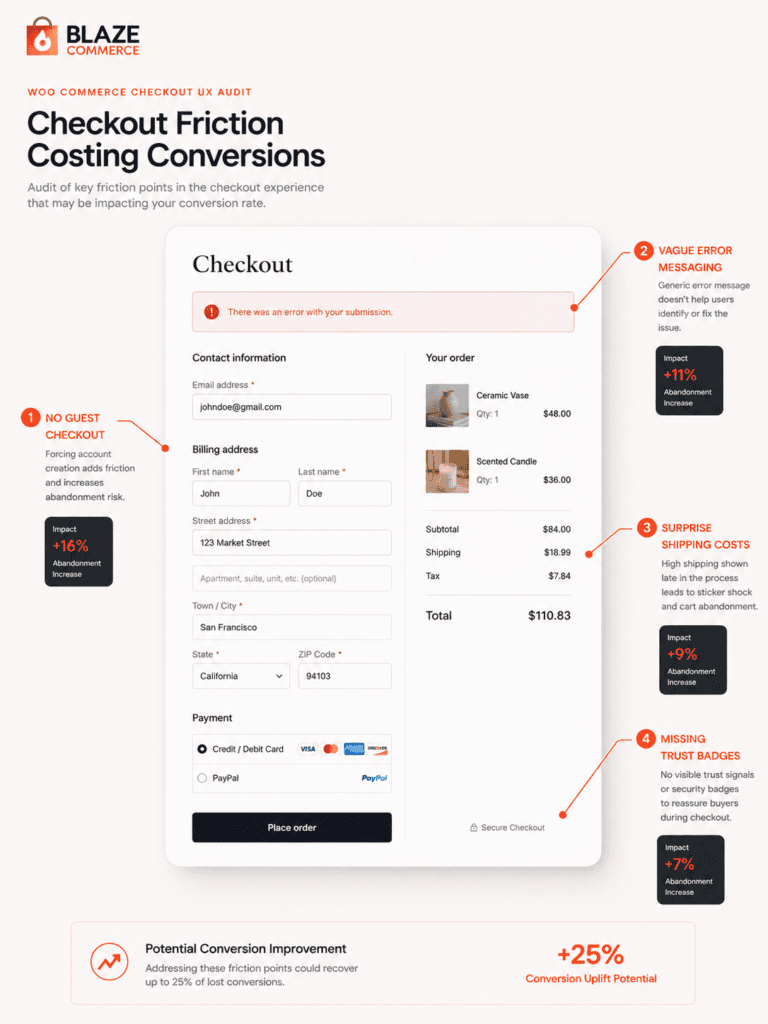
5. Cart and checkout UX
The 70% baseline cart abandonment rate isn’t random – it clusters around specific friction points. Failure patterns: no guest checkout, address forms without autocomplete, missing payment trust signals, error messaging that hides which field broke, shipping cost surprises at the final step.
Every friction point compounds. A checkout with five small failures loses far more than the sum of those five failures.
6. Homepage design
First-impression bounce kills the rest of the funnel. Failure patterns: value prop that doesn’t answer “why this store” in three seconds, navigation that hides the main category structure, mobile above-the-fold density that overwhelms, CTA hierarchy with no primary action.
We’ve seen UX-focused projects lift orders by 58% (Hang Logic) and conversions by 133% (Jackie Mack Jewellery) – without rebuilding the platform underneath. The leverage in resolving these six categories is real and measurable.
How much revenue does poor UX cost a $100K/month store?
Conversion rate ranges by store quality:
- Poor: 0.2–2% (high friction, mobile-broken, search-failing)
- Average: 2–5% (functional but not optimized)
- Strong: 5%+ (UX, performance, and trust working together)
A $100K/month store at 1.5% conversion is doing about $1.2M annually.
Lift conversion to 2.5% – a realistic outcome for a store currently at 1.5% with material UX failures – and the same traffic produces $1.67M annually. That’s $66K in additional monthly revenue. $792K annually. From the same traffic. From resolving the patterns the audit identifies.
That math is aggressive. Most stores don’t see that lift in month one. Some don’t see it for six months. Implementation matters, prioritization matters, and not every pattern delivers the same impact.
But here’s the floor: even a 0.5% conversion lift on $100K/month – going from 1.5% to 2.0% – adds $33K monthly. $400K annually. That’s a conservative outcome from resolving a handful of the worst-performing patterns.
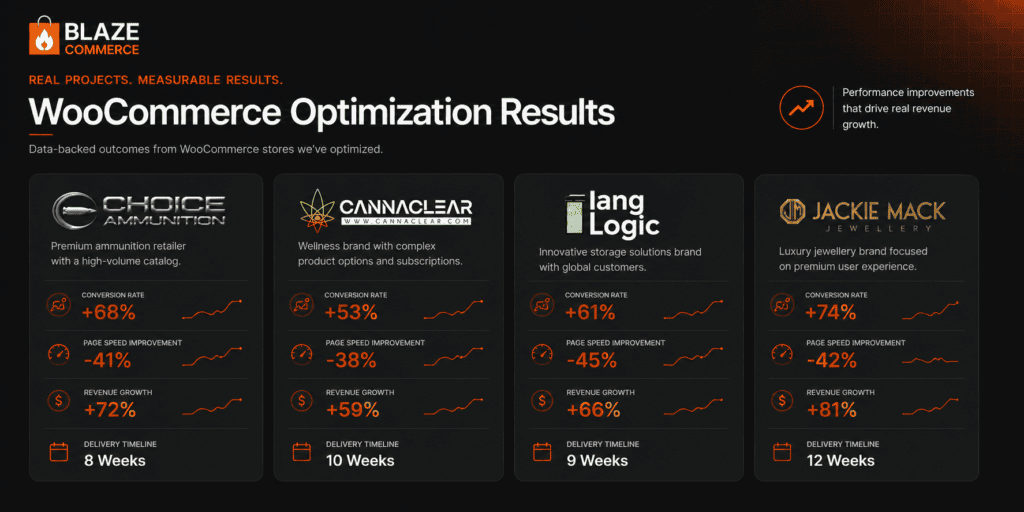
Real client numbers from the past 24 months:
- Choice Ammunition: PageSpeed 31→90, revenue +16%, AOV +20%, delivered in 8 weeks.
- Cannaclear: Revenue +83%, $71.7K/month in recovered revenue, delivered in 9 weeks.
- Hang Logic: Orders +58%, net sales +49%, delivered in 60 days.
- Jackie Mack Jewellery: Mobile speed 7s→0.8s (half-second range), conversions +133%.
The cost isn’t the project investment. The cost is what you’re losing every month you don’t resolve the leaks. A store losing $33K/month to UX failures pays back an entire optimization project in the first 30 days post-launch.
Every month of delay is another $33K to $66K out the door.
When does UX optimization pay back vs replatforming?
Two paths exist for resolving a slow WooCommerce store.
Path A: Optimization. Resolve the failed patterns within your existing WooCommerce install. Investment: $20–35K AUD. Typical payback: 3–4 months. Outcome: 20%+ improvement in performance, conversion, or both. Half-second page loads (460-560ms) achievable through architecture, hosting, and theme work alone.
Optimization keeps everything you already have. Your products stay where they are. Your orders, customers, and inventory stay in WooCommerce. Your team keeps the admin interface they already know. The only thing that changes is how the front-end performs – faster pages, cleaner UX, higher conversion. No migration. No retraining. No risk of losing data in a platform switch.
Path B: Headless build. Build the front-end on a separate framework (Next.js, Remix, or similar), keeping WooCommerce as the back-end. Investment: $70–100K+. Typical payback: 12+ months. Outcome: similar Core Web Vitals and conversion improvements to optimization, with greater long-term flexibility – but a much heavier operational lift to get there. This is the path for high-volume stores, roughly $3M+/year, where checkout is buckling under load.
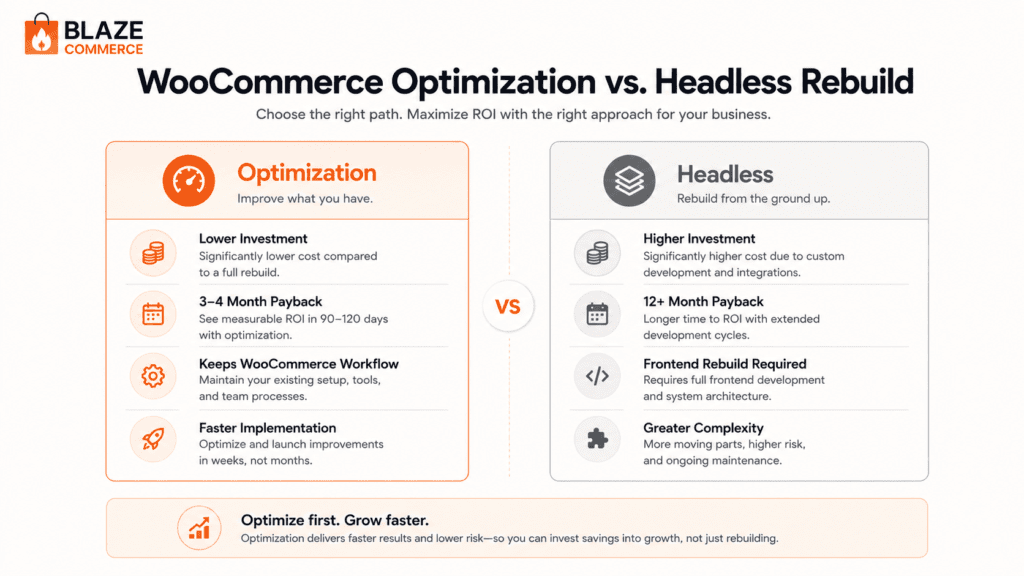
Headless gets pitched constantly. It’s the option agencies love to pitch. But the math only works above a specific revenue threshold.
The threshold: roughly $3M+ annual revenue (about $250K/month), with checkout buckling under load. Below that, the headless investment doesn’t pay back fast enough to justify the risk and complexity. Above it, the additional flexibility starts to matter – multi-storefront deployments, custom mobile experiences, third-party platform integrations.
Below that line, optimization wins on every metric that matters: faster delivery, lower investment, equivalent performance gains, less operational disruption. Most stores reach the same half-second page loads (460-560ms) on their existing WooCommerce stack, for about a third of the cost of a headless build.
We build headless when the math justifies it – for high-volume stores where it earns its keep. For most WooCommerce stores, it doesn’t.
If you’ve been pitched a headless build and the agency couldn’t show you the ROI math, that’s a flag. Read When NOT to Go Headless for the full analysis. Or start my audit and find out which path fits your revenue level.
What does a real WooCommerce UX audit look like?
Five to seven business days from the time we get admin access. Here’s what shows up in the deliverable.
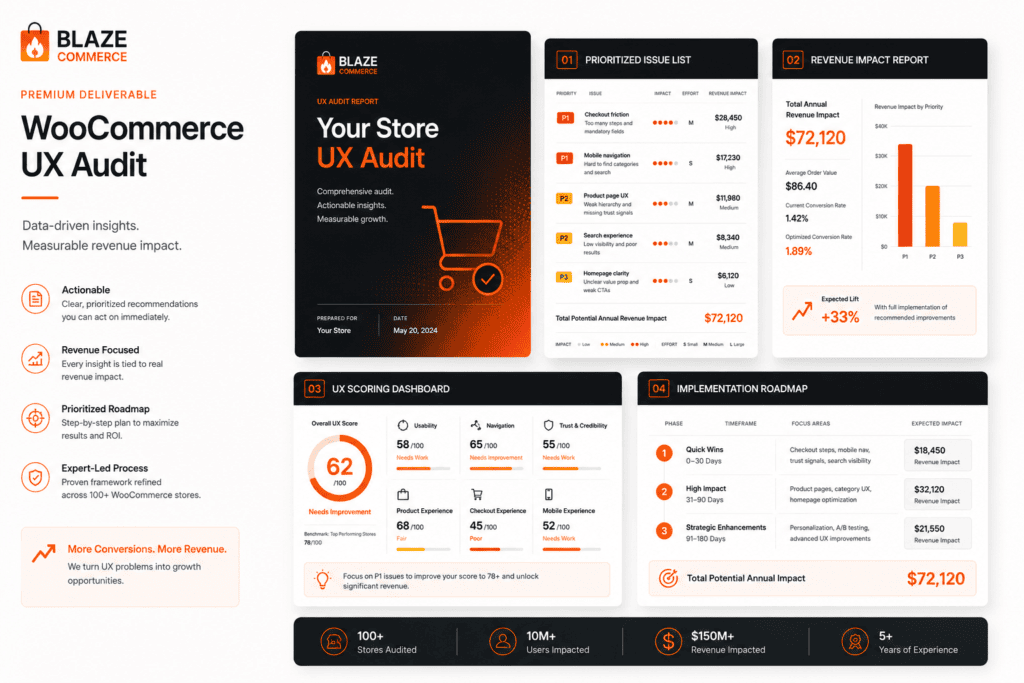
Prioritized list of failed patterns. Every pattern evaluated, failures ranked by revenue impact. Not a 60-page report – a focused list of what to resolve and in what order.
Revenue impact estimate per category. Each failed pattern category gets a dollar estimate based on your current traffic, conversion rate, and AOV. You see exactly which changes move the needle.
Implementation roadmap. Each change gets effort and impact rankings. High-impact, low-effort changes go first. Sequenced for fastest revenue recovery.
Recommendation on optimization vs headless. Based on your revenue level, traffic, and architecture. If headless makes sense – a high-volume store above roughly $3M/year with checkout buckling under load – we’ll say so. If it doesn’t, we’ll explain why optimization reaches the same half-second page loads (460-560ms) on your current stack.
The WooCommerce Revenue Audit. A paid, full diagnosis of your store across performance, UX, analytics, and build – with the specific revenue leaks quantified and a prioritized plan. It pays back fastest for WooCommerce stores doing $20K+/month, where the recovery dwarfs the cost.
The audit isn’t gated behind hiring us for implementation. Most clients hire us. Some take the audit and implement in-house. Both paths work – the audit stands alone as a deliverable.
If you’re ready to see what your store is failing, start my audit.
Frequently asked questions
How long does a WooCommerce UX audit take?
5–7 business days from the time we get admin access. The full UX evaluation runs in parallel with revenue impact modeling, so you receive both in the same deliverable.
Do I need to switch hosting or themes for UX optimization to work?
Sometimes. We’ll tell you upfront if your hosting or theme is a hard blocker. Most stores see meaningful UX wins without migrating, though we recommend Kinsta and Full Site Editing themes for maximum performance ceiling.
Can you audit my store without admin access?
We can run the public-facing portion (~60% of the patterns) without admin. The full audit needs read access to plugins, theme, and analytics to evaluate the remaining 40%.
What tools do you use during the audit?
Code Profiler for plugin analysis, GTmetrix for performance verification, and Baymard’s research as the underlying UX methodology. The UX checklist itself is ours – built from a decade of WooCommerce-specific work layered on top of Baymard’s framework.
What’s the difference between UX optimization and conversion rate optimization?
UX optimization resolves the underlying patterns. CRO tests variations of copy, layout, and offers on top of working UX. Resolve the foundation first – testing variations of broken UX produces unreliable data.
Will UX changes break my SEO?
Done right, no – we preserve URL structure, internal linking, schema markup, and indexable content. Done wrong, yes. This is one of the reasons generalist agencies cause problems: they implement UX changes without understanding the SEO implications.
Do you work with stores using Elementor or Divi?
Yes. We’ll often recommend transitioning to a Full Site Editing theme for a 40–60% performance gain, but it’s not mandatory. Many wins are achievable inside the existing builder.
How quickly will I see revenue results?
Most clients see measurable lift within 4–8 weeks of implementation. Compounding effects show up over 3–6 months as Google reindexes faster pages and conversion improvements stack across more traffic.
What if I’ve already had a UX audit from another agency?
Send it over. We’ll tell you straight whether ours would add value or whether you should implement what you already have. We don’t run audits we don’t think will pay back.
Do you resolve the issues you identify, or hand over a report?
Both options exist. Most clients hire us to implement. Some take the audit and implement in-house. We don’t gate the audit behind implementation.
Stop losing revenue to UX failures you can resolve
Every month of delay costs more than the entire optimization project.
Get my Revenue Recovery Audit
We score your store against the same 245-point Baymard standard we run on every audit, benchmark your mobile PageSpeed, and send the findings within 7 days – each gap ranked by revenue impact.
Get My Revenue Audit →Every gap is tied to a dollar figure and a priority.
Talk directly with Campbell
Founder · 11 years WooCommerce
Schedule a strategy call
30 minutes with Campbell on your UX and performance challenges with WooCommerce – especially if you’re in a restricted vertical where paid ads aren’t an option.
Schedule My Strategy Call →30 minutes. No pitch – an honest assessment of where you stand.