Your customers shop on their phones. You check your store on a desktop. The data says that’s the most expensive habit you have.
A note before we start
This post covers the mobile conversion gap on WooCommerce: why mobile pulls most of the traffic and the smaller share of sales, how six recent store rebuilds closed that gap, and how to find your own mobile-versus-desktop numbers. If you use a screen reader, every data point in the case-study table is also written out in the list below it. Skip to the frequently asked questions if you want the short answers first.
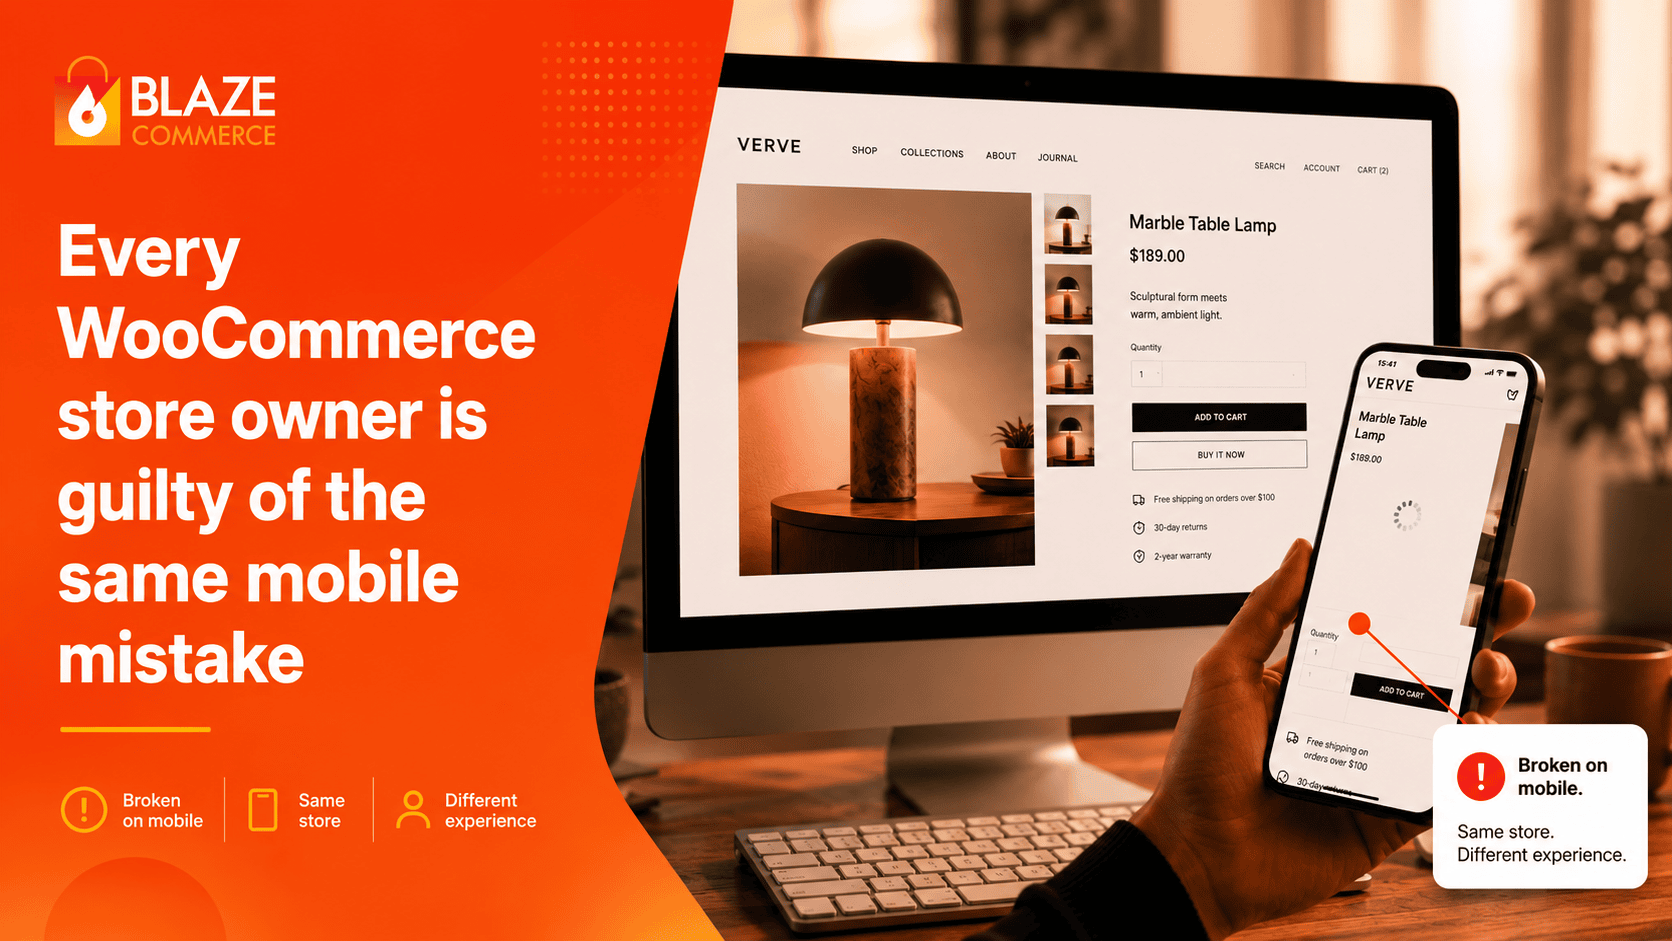
You built the site on a desktop. You check it on a desktop. When you want to know whether something’s working, you open a laptop and click around. The store you experience every day looks fine.
The store your customers experience is a different one. Most of them are on a phone, where it loads slower, the layout jumps as it renders, the search doesn’t find anything, and the checkout drops them halfway through. You never see that version, because you never use it. So when revenue slips, you go looking for the cause in every place except the one it’s hiding.
Mobile is the majority of your traffic and the minority of your sales
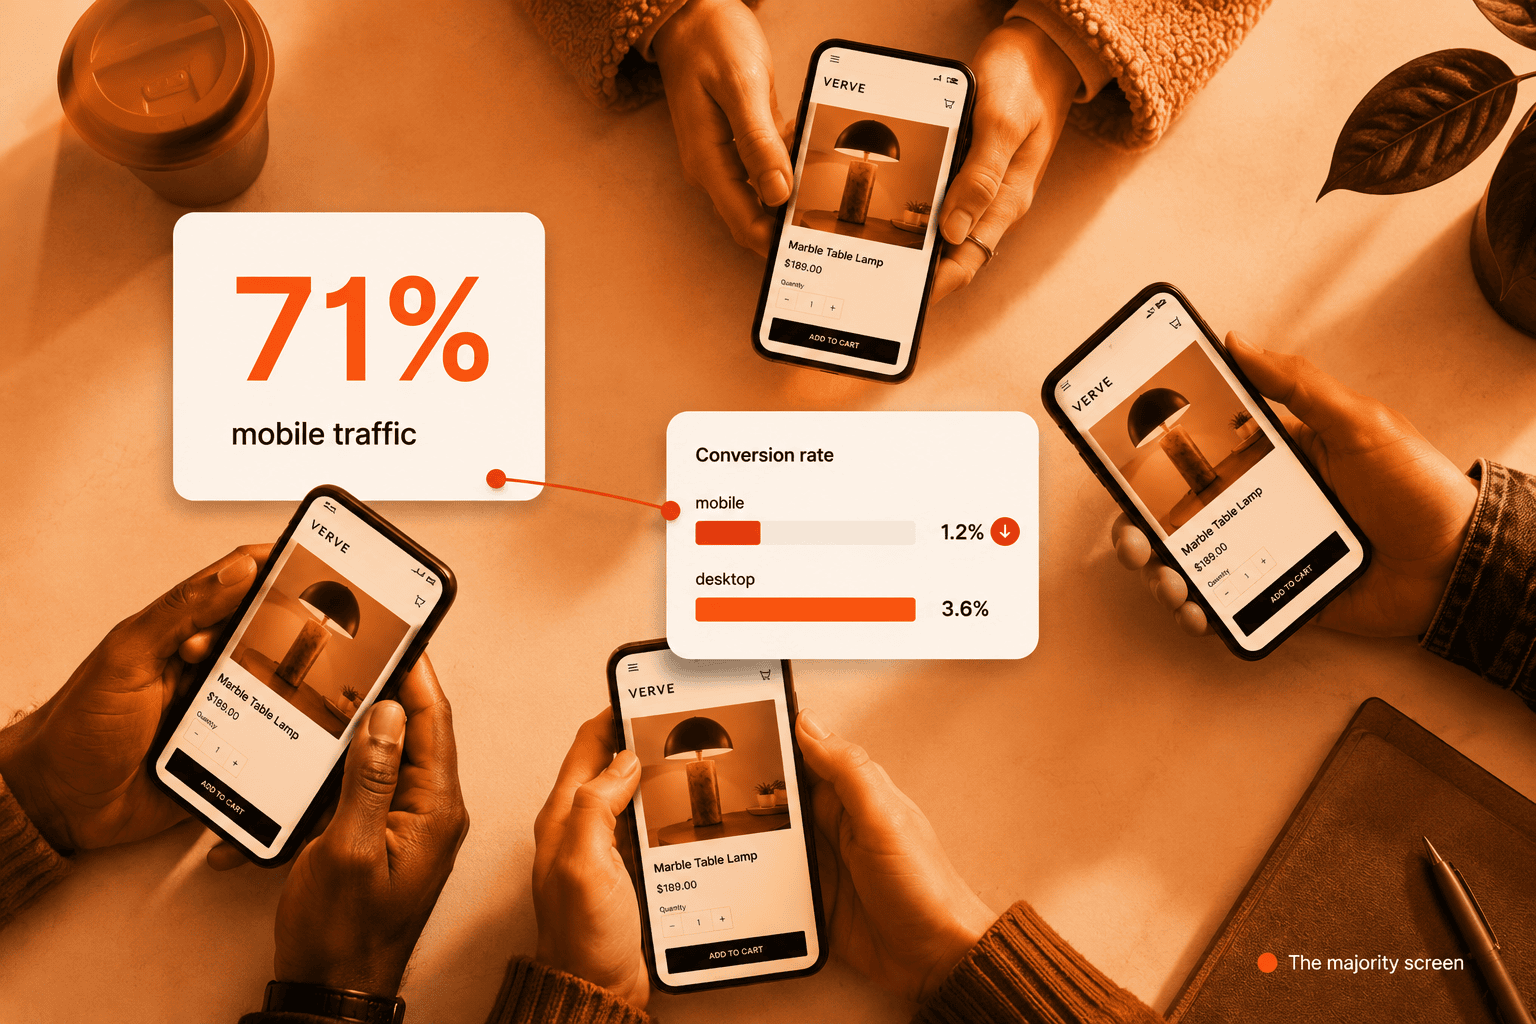
This isn’t a fringe segment. Mobile now drives more than 70% of ecommerce traffic. It also converts worse than desktop almost everywhere, which means it pulls in the majority of your visitors and hands back a smaller share of your sales. That gap, across the whole industry, is the same gap sitting inside your store.
We hear the same theories every week. It’s the ads. It’s an SEO penalty. It’s the economy. It’s the season. Sometimes those are real. More often the problem is sitting on a five-inch screen the owner hasn’t tried to buy from in months.
Each store had a mobile experience quietly losing money the owner couldn’t see – because the owner was looking at the desktop.
The same blind spot, six times
We’ve shipped six WooCommerce projects recently. Firearms, CBD, apparel, picture-hanging systems for builders, and a 25-year mattress retailer. Different industries, different revenue, different stories on paper. The same root cause underneath every one.

The same mobile gap, six times
At a glance
| Store | Mobile PageSpeed | Result |
|---|---|---|
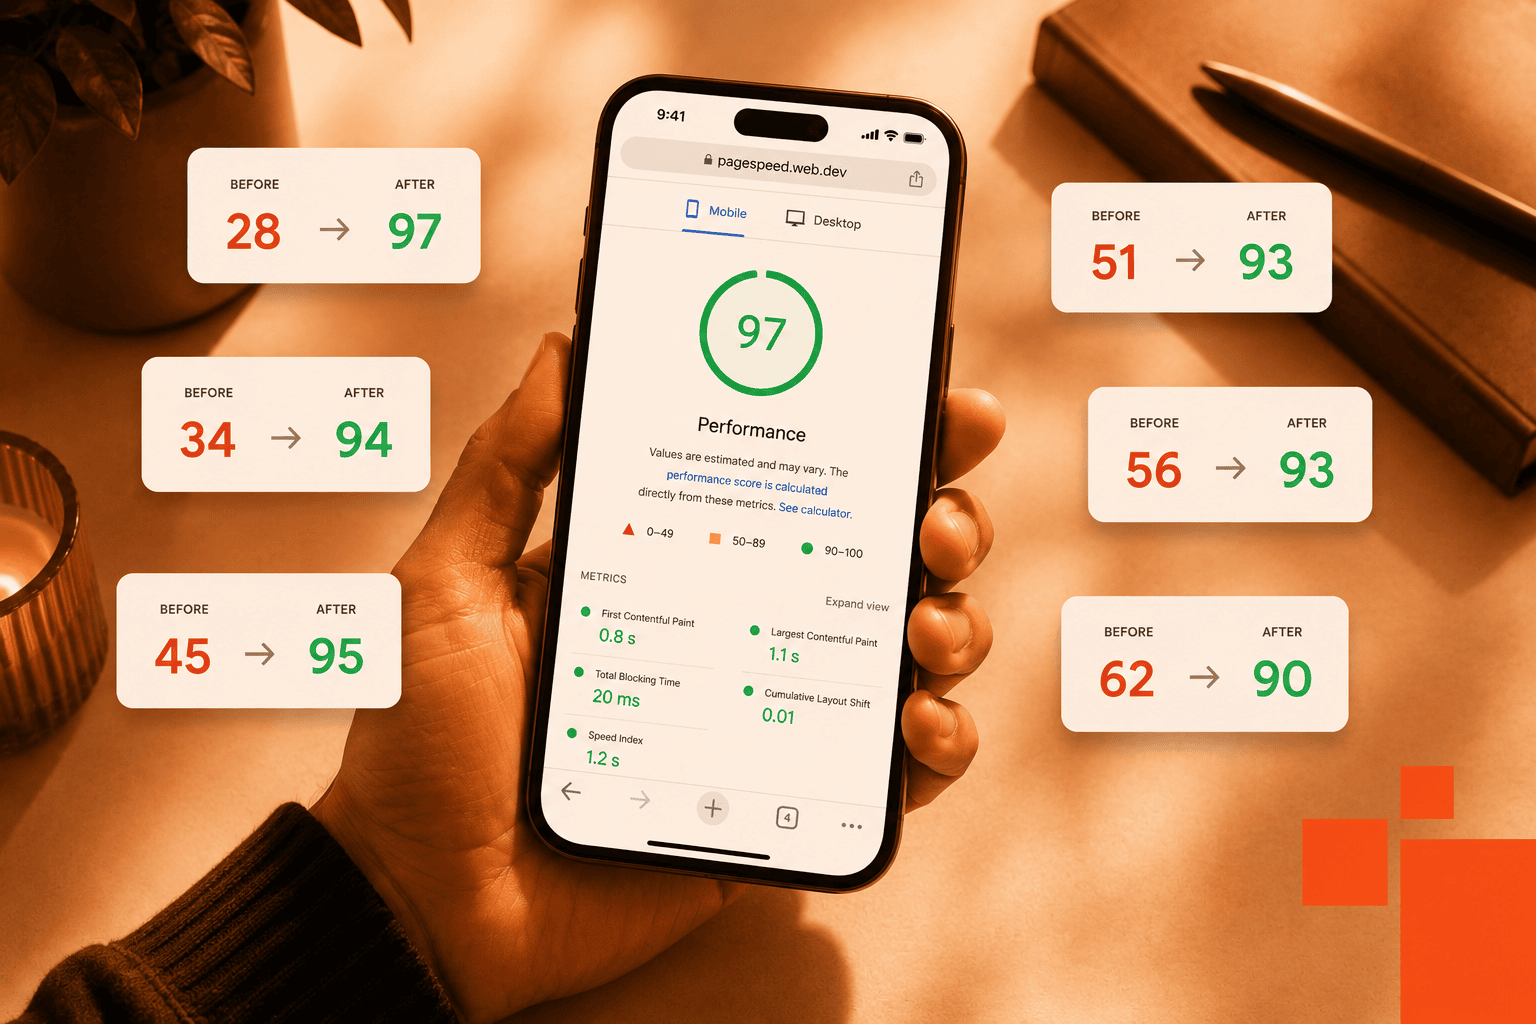
| Hang Logic | 34→94 | Orders +58%, net sales +49% |
| Henry Holsters | 62→90 | AOV +15%, items per order +37% |
| Shine Trim | 51→93 | Orders +28%, net sales +39% |
| Metta Hemp | 56→93 | AOV +28% |
| Cannaclear | 45→95 | Revenue +83%, AOV +58% |
| Austin Natural Mattress | 28→97 | AOV +88%, orders +250% |
The stories
-
01Hang LogicPicture-hanging systems
Paying for Google Ads while 83% of mobile visitors never reached a product. The footer still read “copyright 2000,” forming the wrong impression with the architects and builders they sell to.
Mobile PageSpeed 34→94- Orders +58%
- Net sales +49%
-
02Henry HolstersFirearms accessories
Most traffic on mobile, converting a third worse than desktop. Competitors were loading three times faster and taking the sales that should have been theirs.
Mobile PageSpeed 62→90- AOV +15%
- Items/order +37%
-
03Shine TrimApparel & trim
Mobile shoppers spending far less per order than desktop buyers. The owner assumed that was normal, after grappling with a site that had given her trouble “from the dawn of time.”
Mobile PageSpeed 51→93- Orders +28%
- Net sales +39%
-
04Metta HempCBD · restricted vertical
Paid ads aren’t available, so every visitor counts double – and two-thirds of them never reached a product. On the morning of our call, a state regulator banned half their range overnight, turning the website into the only growth channel left.
Mobile PageSpeed 56→93- AOV +28%
-
05CannaclearCBD
Stable traffic and falling revenue, and nobody could tell them why. Revenue had dropped 70% over a year, and the owner was scared to touch the site himself. His words: “I’m afraid I’ll break something.”
Mobile PageSpeed 45→95- Revenue +83%
- AOV +58%
-
06Austin Natural MattressMattress retail · 25 years
A recent rebuild had taken the site backwards on SEO and conversions, and the owner never felt it represented his brand. He sells $50,000 mattresses, and the site didn’t carry that.
Mobile PageSpeed 28→97- AOV +88%
- Orders +250%
Want the detail behind any of these numbers? The full write-ups on Hang Logic and Metta Hemp walk through what we found and what changed.
None of these were speed problems. They were trust problems.
Look at what those six owners had in common before we started. Not one of them was sitting on a mobile experience they’d personally tried to buy from. Each had a working theory about the cause, and each theory pointed somewhere other than the phone.
None of these were really speed problems. They weren’t layout problems or search problems or checkout problems either, not at the root. Ecommerce runs on trust. If a customer doesn’t trust the brand or the store, they don’t buy, and there’s no clever copy or discount that gets around it.
A visitor who lands on a slow, jumping, broken mobile site doesn’t think “this is slow.” They decide they don’t trust the place, and they leave. Every change we made across those six stores was in service of earning that trust and keeping it, from the first paint of the page through to the confirmation screen. The owner couldn’t see any of it, because the trust verdict gets made on the one screen they never check.
We’ll show you exactly where your store loses revenue.
We audit your store across UX, performance, and conversion, then show you the specific issues costing you orders – each one measured against revenue impact. You get a prioritised list of what’s losing money and what it’s worth to resolve.
- ✓239-point Baymard UX audit
- ✓Core Web Vitals + LCP + CLS benchmark
- ✓SemRush health benchmark
Every finding comes with the revenue it’s costing you and the lift from resolving it. You decide what’s worth doing.
Do you know your mobile conversion rate specifically?
So the question worth answering this week is a simple one. Is your store converting at the level you know it could be? Every owner we speak to knows their Woo store should be doing better than it is, and they’re usually right. The first place to look is the one they’ve never checked.
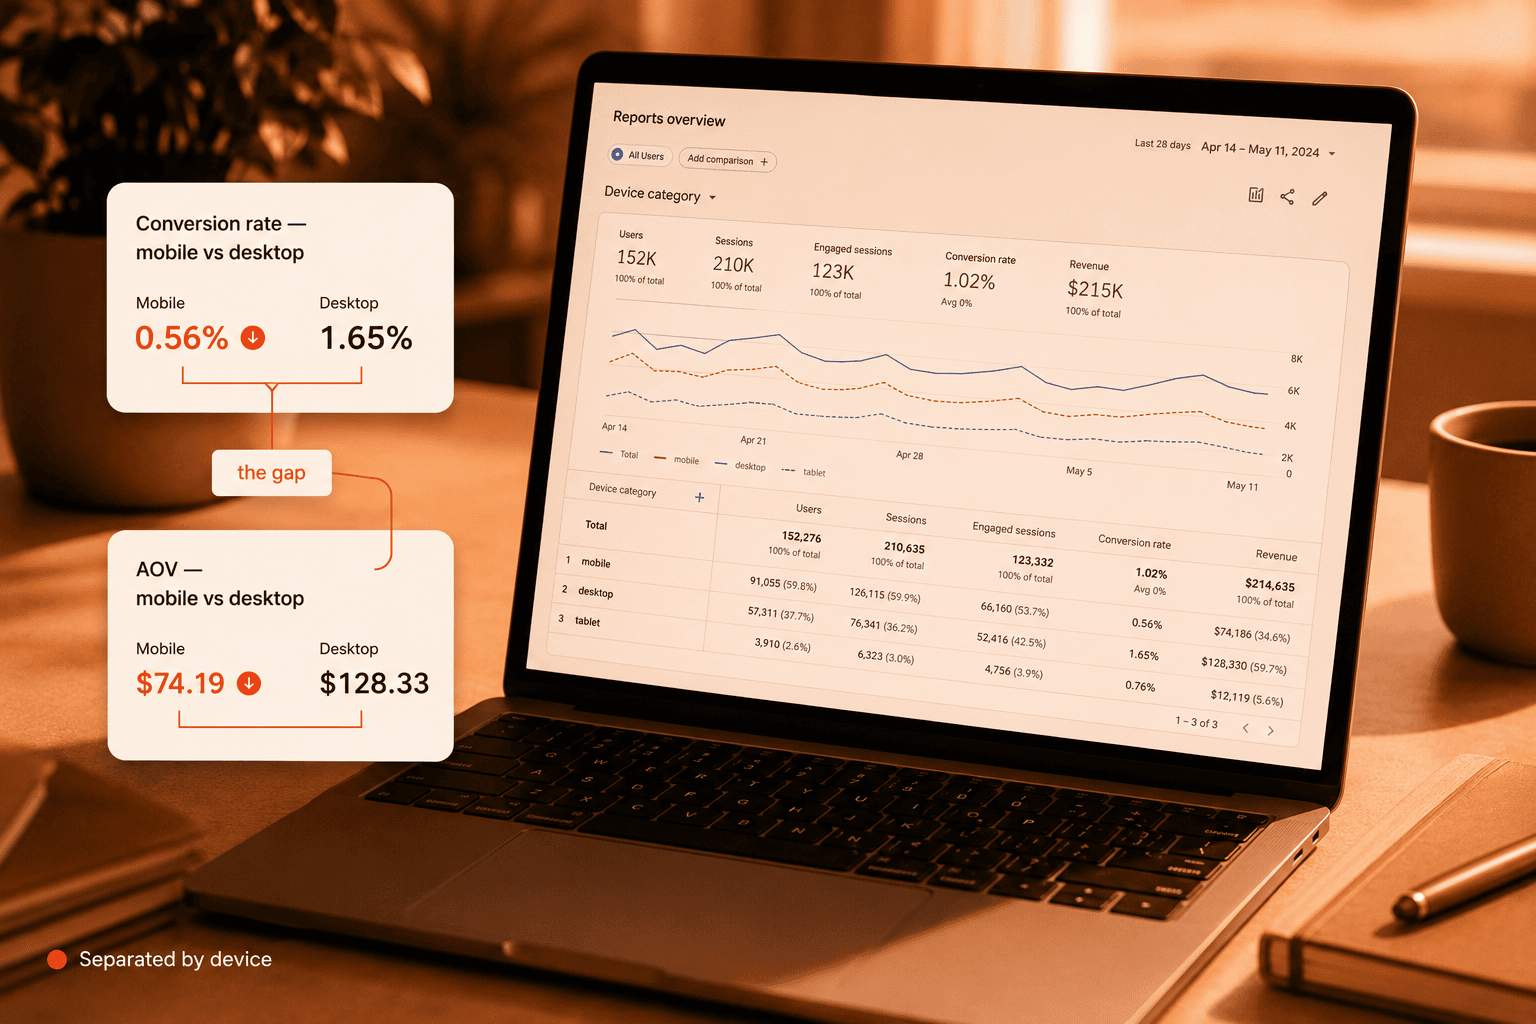
Do you know what your conversion rate and average order value look like for mobile visitors specifically? It’s not in any default GA4 report. You either build the report yourself or work it out by hand, which is why almost no one running a store has the number in front of them. Owners know their overall conversion rate. Very few know the gap between mobile and desktop, and the gap is where the money is.
When did you last open your own store on your phone and try to buy something? And when did you last do the same on your closest competitor’s site, and compare the two?
We’ll show you exactly where your mobile experience loses revenue.
Send two screenshots from your Google Analytics and we’ll send back the analysis showing your mobile-versus-desktop gap – the conversion rate and average order value most owners have never seen separated by device. It takes you two minutes.
- ✓Mobile vs desktop CR & AOV, separated
- ✓Core Web Vitals + LCP + CLS benchmark
- ✓WooCommerce UX audit
We’ll tell you which two screenshots to grab. You’ll see where your mobile experience stands before you decide anything.
Frequently asked questions
What is the mobile conversion gap in ecommerce?
The mobile conversion gap is the difference between how your mobile visitors convert and how your desktop visitors convert. Mobile usually pulls the larger share of traffic and the smaller share of sales, so the gap is where revenue quietly leaks. Most owners track their overall conversion rate and never separate the two, which is why the gap goes unnoticed.
Why does mobile convert worse than desktop on WooCommerce?
Mobile shoppers meet slower loads, layout shift as the page renders, weaker search, and a longer checkout on a five-inch screen. Each erodes trust, and a visitor who doesn’t trust a store leaves before buying. The desktop view the owner checks every day hides all of it.
How do I find my mobile vs desktop conversion rate in GA4?
It isn’t in any default GA4 report. You build a custom report that segments conversion rate and average order value by device category, or work it out by hand. Most owners know their overall rate but have never seen the mobile-versus-desktop split, which is where the lost revenue sits.
What’s a good mobile PageSpeed score for a WooCommerce store?
A mobile Lighthouse performance score of 90 or above lands in the green band. Many WooCommerce stores sit in the 30s to 50s on mobile without the owner realizing, because the score they remember is the faster desktop one.
Is slow mobile speed really costing me sales?
Speed is the symptom, not the root cause. Across six recent rebuilds, raising mobile PageSpeed alongside layout, search, and checkout work lifted orders, average order value, and revenue – because the underlying win was earning the shopper’s trust on the screen they use.
How much WooCommerce traffic comes from mobile?
For most stores, mobile is 70-80% of traffic. That makes the mobile experience the primary one, not a secondary view of the desktop site. When the majority of visitors arrive on a phone, a mobile experience that converts worse than desktop is the single largest lever on revenue.
Field Notes – biweekly thoughts on WooCommerce & ecommerce, from the team at Blaze Commerce.
Get my Revenue Recovery Audit
We score your store against the same 245-point Baymard standard we run on every audit, benchmark your mobile PageSpeed, and send the findings within 7 days – each gap ranked by revenue impact.
Get My Revenue Audit →Every gap is tied to a dollar figure and a priority.
Talk directly with Campbell
Founder · 11 years WooCommerce
Schedule a strategy call
30 minutes with Campbell on your UX and performance challenges with WooCommerce – especially if you’re in a restricted vertical where paid ads aren’t an option.
Schedule My Strategy Call →30 minutes. No pitch – an honest assessment of where you stand.